A mental map is a graphical representation based upon a person's point of view. The mental map above shows a depiction of what a Bostonian might think a map of the United States is like.
A hypsometric map represents elevation of a surface map using tints. The hypsometric map above uses tints to show surface elevations of the United States.
An isopleth map shows lines of constant variables, known as isopleth lines. The isopleth lines connect constant variables within a surface map. The maps above are examples of isopleth maps.
A star plot is a graphical representation of a data set over a number of different variables. Plotting the data set along each axis creates a graphic showing how the variable correlates to the axis. The star plot above shows the variable's relationship with letter identification, hearing, reading, writing, and concepts.
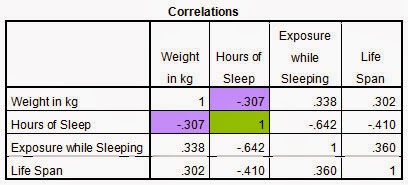
A correlation matrix describes the correlation among a variable within the matrix. In the correlation matrix above, the correlation between weight, hours of sleep, exposure while sleeping, and life span are compared within the matrix.
A similarity matrix represents the similarities between two data variables. The similarity matrix above shows data between Black Maple and Sugar Maple tress in Ohio.
A stem and leaf plot shows the frequency of a data set in a graphical format. In the stem and leaf plot above, the stems and leafs show the frequency of a given variable.